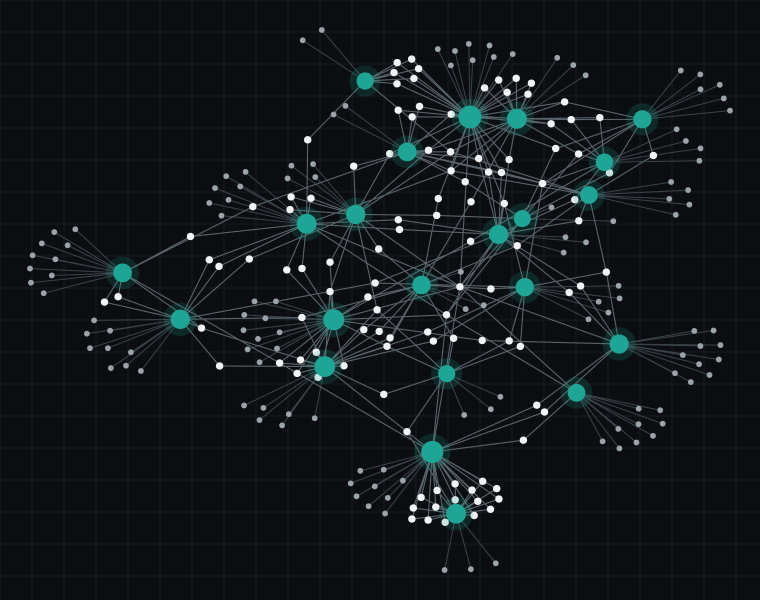
Product Graph
How an industry actually works, modelled.
Actors, workflows, constraints, assets, decisions, and what done means. The product becomes a guided walk through the domain.

Inside the product, the Product Graph holds the work itself: who acts, in what order, under which rules, until it is done.
Inside the product
Four things every vertical has.
Modelled once, in a format we define, and reused by every screen and every agent.
Actors
Who acts in the industry: candidates and employers, regions and nurses, buyers and refineries.
Workflows
The steps the work actually follows, in order, including the ones that loop back.
Constraints and assets
Licences, materials, budgets, capacity and deadlines: what limits the work and what it uses.
Decisions and done
What has to be decided, by whom, and what counts as finished.
Modelled verticals
Same engine, different work.
The graph models the work. Agents run the loop. The dashboard gives the proof and the next action.
- Nation.dev, tech talentDeveloper onboarding, adaptive tests and interviews, evidence per skill, personal upskilling, open roles and private match dashboards.
- Healthcare partner, care staffingAvailability, licences, regions, roles, compliance and shift demand.
- Precious metals businessSourcing, refining, assay and purity, production, compliance checks, delivery and the handling of deviations.
- The next verticalStarts from the same attribute language, so the core is not rebuilt.
Precious metals, order to delivery
- Order
- Sourcing
- Refining
- Assay
- Production
- Delivery
- Deviation handling
Inside and outside
Two graphs, one language.
The Product Graph is the inside view of a vertical; the Intelligence Graph is the outside view. Shared attributes join them, so the product knows who to talk to, when, and with what proof.
